Beginner’s Guide to Trading With Candlestick Charts
Beginner’s Guide to Trading With Candlestick Charts
Candlestick charts are one of the most powerful tools for beginners to analyze stock price movements and make informed trading decisions. In this guide, I’ll show you how I read candlestick charts, identify patterns, and combine them with my system to generate consistent monthly income from trading.

Table of Contents
Why Candlestick Charts Are Essential
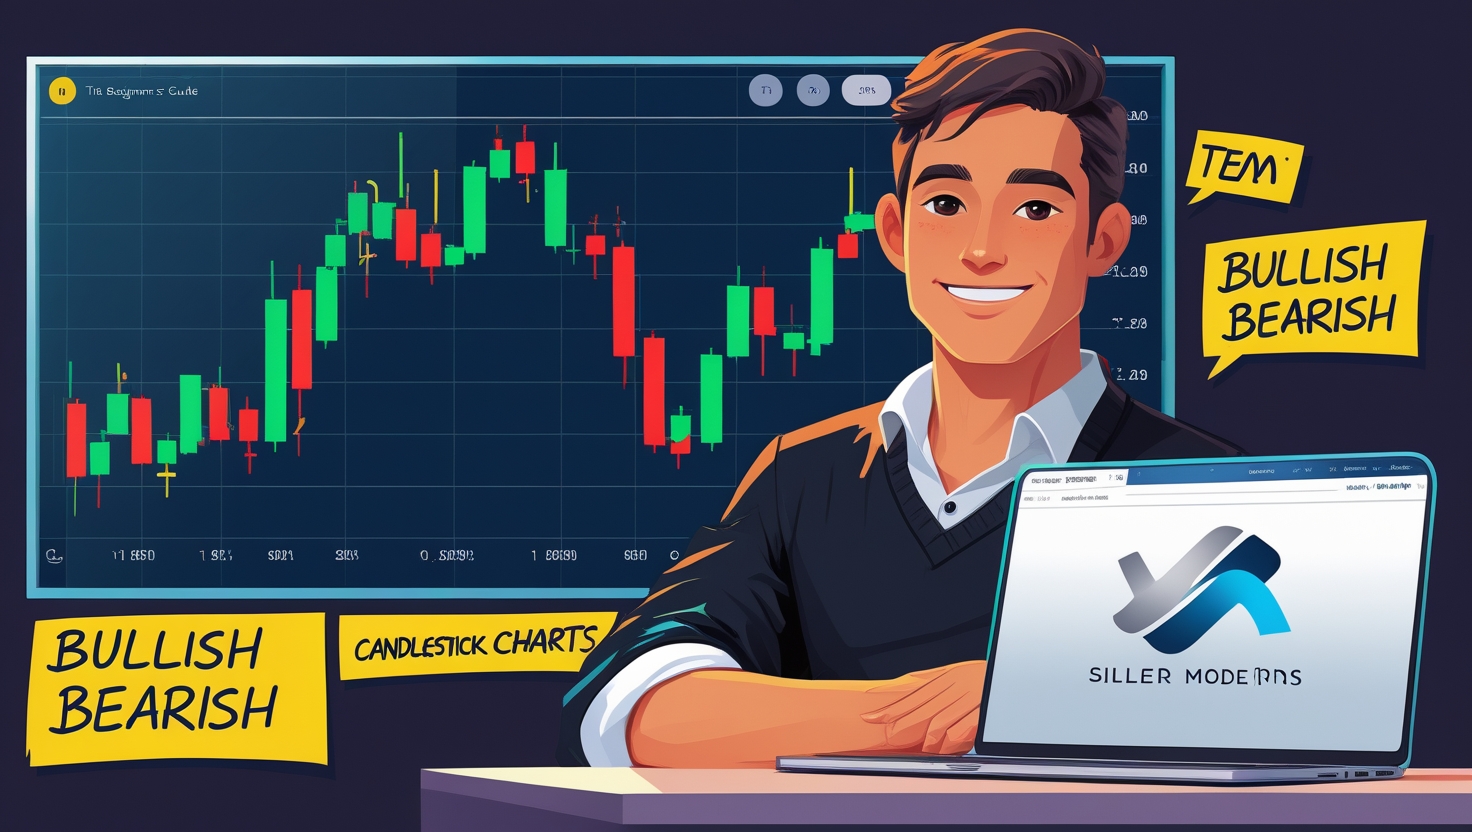
Candlestick charts show open, high, low, and close prices in a visually intuitive way.
Unlike line charts, candlestick charts provide more information about price action, momentum, and market sentiment.
By learning to read candlestick charts, beginners can spot potential trend reversals, breakouts, and continuation patterns more accurately.
Understanding Candlestick Basics
Each candle has a body and wicks (shadows).
- The body represents the difference between the open and close prices.
- Wicks show the highest and lowest prices reached during the period.
- Green or white candles indicate upward movement, while red or black candles indicate downward movement.
Common Candlestick Patterns for Beginners
Some of my favorite beginner-friendly patterns include:
- Doji – Signals indecision in the market and potential reversals.
- Hammer and Hanging Man – Indicates potential trend reversal at support or resistance.
- Engulfing Patterns – Shows strong bullish or bearish sentiment.
Using these patterns with TradingView allows me to spot high-probability setups quickly: https://www.tradingview.com/?aff_id=155687
Step 1: Start With Simple Patterns
As a beginner, I focus on one or two patterns at a time.
This keeps me from feeling overwhelmed and helps me trade confidently using reliable setups.
Step 2: Combine With Indicators
Candlestick patterns become much more powerful when combined with indicators like RSI, MACD, and moving averages.
This combination improves my probability of picking winning trades and minimizes risk.
Step 3: Apply to Your Trading System
I integrate candlestick chart setups with my system from How I Pay My Bills Monthly With Stocks to turn signals into consistent monthly income.
Scanning for these patterns daily helps me stay consistent and make profitable trades without overanalyzing the market.
Step 4: Track and Review
I log every trade based on candlestick setups to see which patterns perform best.
Regular review allows me to refine my approach and build confidence over time.
Getting Started Today
Begin by studying one candlestick pattern, practicing it on paper trading, and gradually combining it with indicators.
Using candlestick charts effectively helps beginners spot profitable trades, manage risk, and trade confidently, even with minimal experience.
Candlestick charts give me a clear visual of market sentiment, helping me see when buyers or sellers are dominating, which is crucial for spotting potential trend reversals.
I focus on high-probability candlestick patterns like hammers, dojis, and engulfing candles, which provide strong clues about the next likely price movement.
Combining candlestick patterns with indicators such as RSI allows me to confirm whether a stock is overbought or oversold before entering a trade.
Volume confirmation alongside candlestick patterns improves my confidence that a breakout or reversal is legitimate and not just a false signal.
I use TradingView to overlay multiple indicators on candlestick charts, giving me a comprehensive view of price action in real-time: https://www.tradingview.com/?aff_id=155687
Candlestick charts allow me to see market micro-movements that line charts don’t show, which helps me make more precise entries and exits.
I often start by analyzing daily and 1-hour candlestick charts to identify strong setups before drilling down to smaller timeframes for execution.
Using candlestick charts consistently has helped me build a structured trading routine, reducing emotional decisions and increasing consistency.
I integrate candlestick chart signals with my system from How I Pay My Bills Monthly With Stocks to turn high-probability setups into monthly income.
Even as a beginner, practicing candlestick pattern recognition daily helps me improve my timing and confidence in executing trades.
I focus on simplicity, avoiding overcomplicated charts, and only track patterns and indicators that directly influence my trading strategy.
Logging every trade with candlestick setups allows me to identify which patterns perform best, helping me refine my strategy over time.
Candlestick charts are excellent for spotting trend reversals at key support and resistance levels, which often lead to high-probability trades.
I also use candlestick patterns to confirm trends and avoid entering trades against strong market momentum, minimizing risk.
Finally, mastering candlestick charts has transformed my trading, giving me the confidence and structure to trade efficiently while building consistent monthly income.
I pay close attention to candlestick wicks, as long upper or lower shadows often indicate strong rejection of price levels, helping me predict potential reversals.
Combining multiple candlestick patterns in a single chart can provide stronger confirmation of a trend, increasing my confidence in taking trades.
I also focus on the context of patterns—candlestick signals near support or resistance levels are far more reliable than random patterns in the middle of a trend.
Using TradingView alerts for specific candlestick formations allows me to act immediately when a stock meets my criteria: https://www.tradingview.com/?aff_id=155687
I practice pattern recognition daily, which has helped me reduce hesitation and execute trades faster, even under volatile market conditions.
Candlestick charts also make it easier to combine technical analysis with my system from How I Pay My Bills Monthly With Stocks, turning setups into real income.
By focusing on candlestick patterns, combined with smart indicators and alerts, I can trade more efficiently, reduce risk, and maintain consistent profits as a beginner.
I always review previous candlestick formations to understand market behavior, which helps me anticipate likely price movements and avoid impulsive trades.How I Pay My Bills Monthly With Stocks,
Candlestick patterns work best when paired with my watchlist, allowing me to focus only on stocks that meet my strategy and have strong potential setups. How I Pay My Bills Monthly With Stocks,
Using candlestick charts consistently, along with my system from How I Pay My Bills Monthly With Stocks, allows me to trade confidently and turn patterns into reliable monthly income.

Stay ahead in the stock market! Subscribe to our newsletter and receive exclusive stock flow reports, trading insights, and actionable tips directly in your inbox. Join thousands of traders who get our updates first.