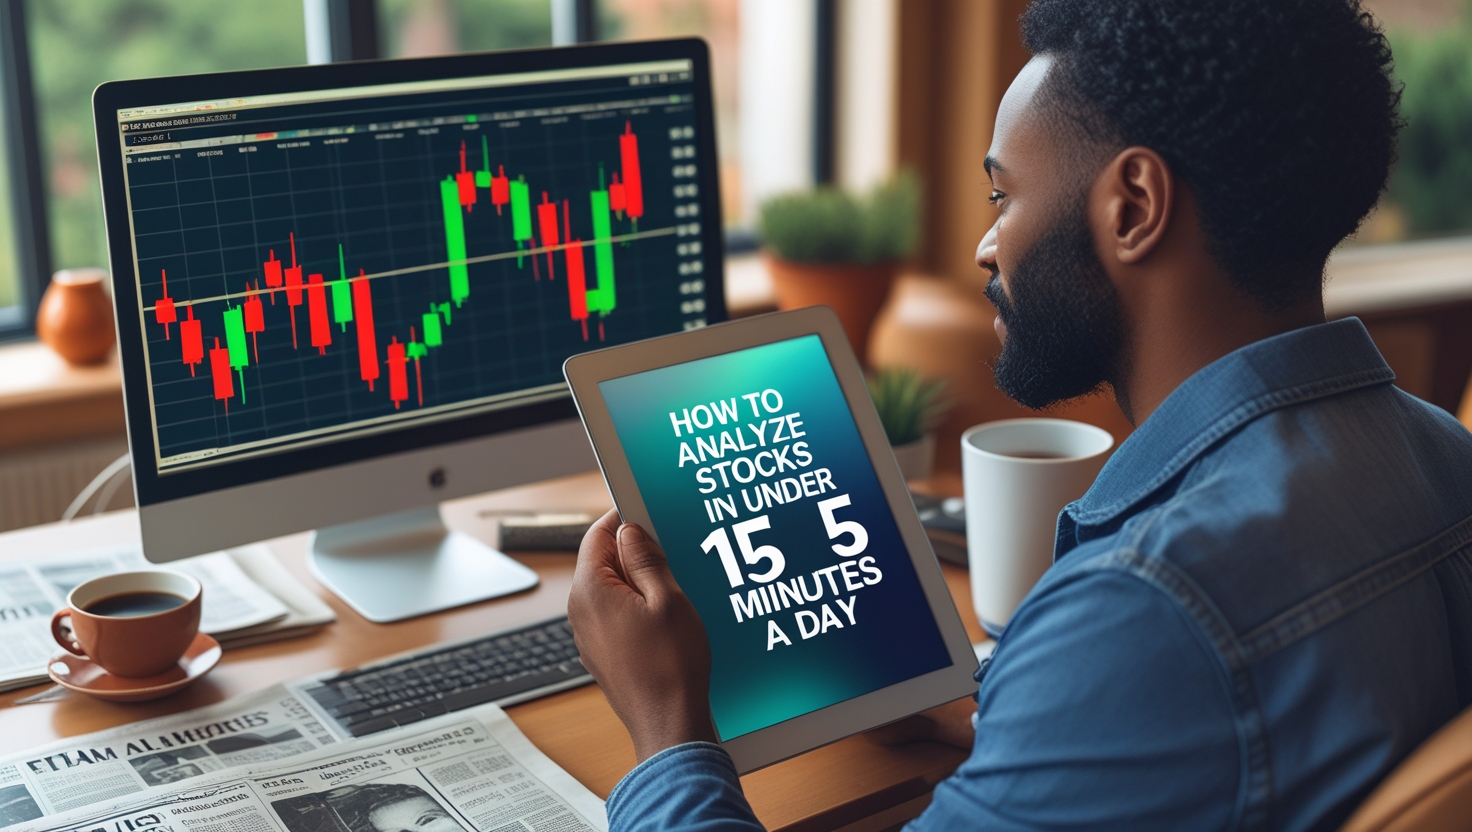
How to Analyze Stocks in Under 15 Minutes a Day
How to Analyze Stocks in Under 15 Minutes a Day
Struggling to find time to analyze stocks? I used to spend hours staring at charts without knowing if it was worth it. In this guide, I’ll show you how to analyze stocks in under 15 minutes a day, even as a beginner, using simple steps and tools that help me trade confidently and generate monthly income from stocks.

Table of Contents
Why Quick Stock Analysis Matters
When I first started trading, I thought I had to spend all day watching charts. That quickly became exhausting and stressful. I learned that with the right approach, I can analyze stocks quickly and effectively without sacrificing accuracy.
By focusing on key data points and using the right tools, I can identify opportunities, spot trends, and plan trades in a fraction of the time. For beginners, this approach prevents overwhelm and burnout.
Step 1: Start With a Watchlist
The first thing I do each morning is review my watchlist. This list contains only the stocks I’m interested in or have potential setups for the day.
A focused watchlist allows me to:
- Quickly scan for price movement
- Check trends and indicators without distractions
- Save time by analyzing only the stocks that matter
Step 2: Use Candlestick Patterns
I focus on candlestick charts to quickly assess stock behavior. Candles show price movement over a specific period and reveal trends, reversals, or continuation patterns.
By recognizing patterns like hammers, doji, or engulfing candles, I can make faster decisions and avoid spending hours studying every stock.
Step 3: Apply Key Indicators
Instead of using dozens of indicators, I focus on a few essential ones:
- Moving averages for trend direction
- RSI to detect overbought or oversold conditions
- MACD to confirm momentum
These indicators allow me to quickly assess a stock’s strength and potential direction without overcomplicating my analysis.
Step 4: Check Volume
Volume is a powerful tool for understanding market interest. I look for unusual volume spikes, which often signal that a stock is ready to move.
Even spending a few seconds reviewing volume can save me from entering trades that lack momentum or avoiding false breakouts.
Step 5: Use Alerts for Efficiency
One trick I rely on is setting alerts. Instead of constantly checking charts, I get notified when a stock hits key levels or triggers indicator signals.
This feature lets me react instantly while still focusing on other tasks or enjoying my day.
Step 6: Choose the Right Software
Having reliable software makes this process much faster. I use TradingView because it’s intuitive, customizable, and powerful for tracking multiple stocks efficiently.
TradingView helps me:
- Apply indicators in seconds
- Organize watchlists
- Set alerts and notifications
- Access real-time charts without delay
Even beginners can master the basics quickly and make informed trading decisions.
Step 7: Track Your Trades
After analyzing stocks, I log potential setups in a trade journal. This step only takes a minute but allows me to track my progress, learn from mistakes, and refine my approach.
Keeping a record of trades has been a key factor in my ability to trade consistently and reduce mistakes.
Step 8: Combine With a Proven System
Quick analysis works best when combined with a proven system. My ebook, How I Pay My Bills Monthly With Stocks, shows exactly how I structure trades and make consistent monthly income using fast, effective stock analysis.
Even with just 15 minutes a day, this approach has allowed me to stay on top of the market and trade confidently.
Conclusion: Trade Smart, Not Long
Analyzing stocks doesn’t have to take hours. By focusing on watchlists, candlestick patterns, key indicators, volume, and alerts, you can complete your analysis in under 15 minutes a day.
Start today by signing up for TradingView: https://www.tradingview.com/?aff_id=155687
To learn my complete method for turning quick stock analysis into monthly income, check out my ebook: https://stockflowreport.gumroad.com/l/paybillswithstocks
With the right approach, tools, and system, you can trade smarter, not longer, and take control of your financial goals.
When I first tried analyzing stocks, I thought it required hours of staring at charts. I quickly learned that focusing on the right steps and tools allows you to analyze stocks quickly and effectively without getting overwhelmed.
A watchlist is the foundation of my daily analysis. By limiting my focus to a select group of stocks, I can spot trends and opportunities faster and avoid wasting time on irrelevant options.
Candlestick patterns became my favorite part of quick analysis. Even spending a few minutes identifying simple patterns like hammers or engulfing candles gives me insights into potential market moves.
Indicators like RSI, MACD, and moving averages help me confirm what I’m seeing on the charts. Using just a few reliable indicators saves time while still giving me confidence in my trades.
Volume is another key factor I check quickly. A sudden spike in volume can signal that a stock is about to move, helping me make informed decisions without spending hours analyzing data.
Alerts are a game-changer for beginners. I set notifications for price levels or indicator signals so I can act immediately when an opportunity appears, without being glued to my screen all day.
I also use TradingView because it streamlines my analysis process. With customizable charts, watchlists, and alerts, I can analyze multiple stocks in minutes and still be thorough.
Reviewing historical charts helps me understand how a stock behaves under different market conditions. This insight allows me to anticipate possible reversals or continuation trends quickly.
Even as a beginner, keeping a simple trade journal has been invaluable. Logging trades and noting why I entered or exited helps me learn from mistakes and improve strategies over time.
Combining these tools with a step-by-step system, like the one I outline in my ebook How I Pay My Bills Monthly With Stocks, turns my quick analysis into real, actionable results.
Practicing these steps every day, even for just 15 minutes, has built my confidence. I no longer feel overwhelmed by charts or indicators; instead, I know exactly what to look for and how to act.
Finally, understanding that quality beats quantity in analysis was a major breakthrough. Spending a focused 15 minutes with the right tools and approach is far more effective than hours of scattered chart-watching.

Stay ahead in the stock market! Subscribe to our newsletter and receive exclusive stock flow reports, trading insights, and actionable tips directly in your inbox. Join thousands of traders who get our updates first.


