The Easiest Way to Understand Candlestick Charts
The Easiest Way to Understand Candlestick Charts
Learn the easiest way to understand candlestick charts 📊 I’ll share my personal tips, simple strategies for beginners, and how you can use them to make smarter stock trading decisions.

Table of Contents
The Easiest Way to Understand Candlestick Charts
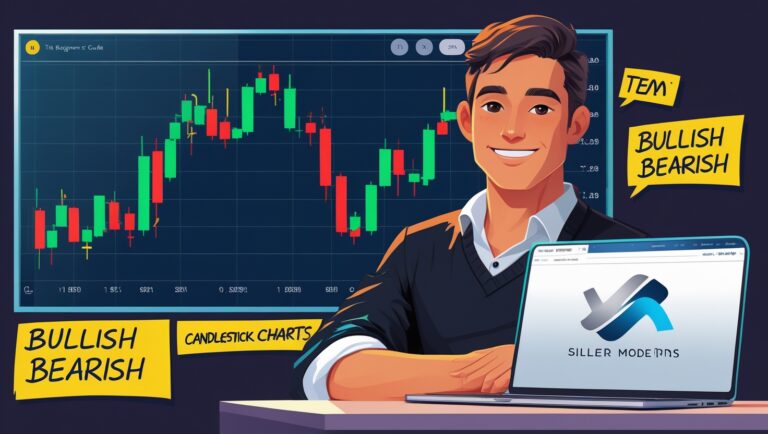
When I first started trading, candlestick charts looked intimidating. The red and green bars, wicks, and patterns all seemed like a secret language. But over time, I realized that understanding candlestick charts is simpler than it looks—especially with the right tools and a beginner-friendly approach.
Candlestick charts are essential for analyzing stocks because they show price movements over time. Unlike line charts, they give more information: open price, close price, high, low, and overall market sentiment. Once you understand the basics, you can use them to spot trends, reversals, and opportunities.
Why I Rely on Candlestick Charts
I personally use candlestick charts every day to guide my trades. They help me:
- See buying and selling pressure
- Identify trends and reversals quickly
- Make informed decisions before executing trades on Robinhood or Webull
- Track my progress and analyze patterns over time
Tools like TradingView make it easy for beginners to access candlestick charts and even add indicators to simplify analysis. Start here: TradingView Affiliate Link.
Candlestick Basics for Beginners
Candlestick charts might seem complex at first, but here’s a simple breakdown:
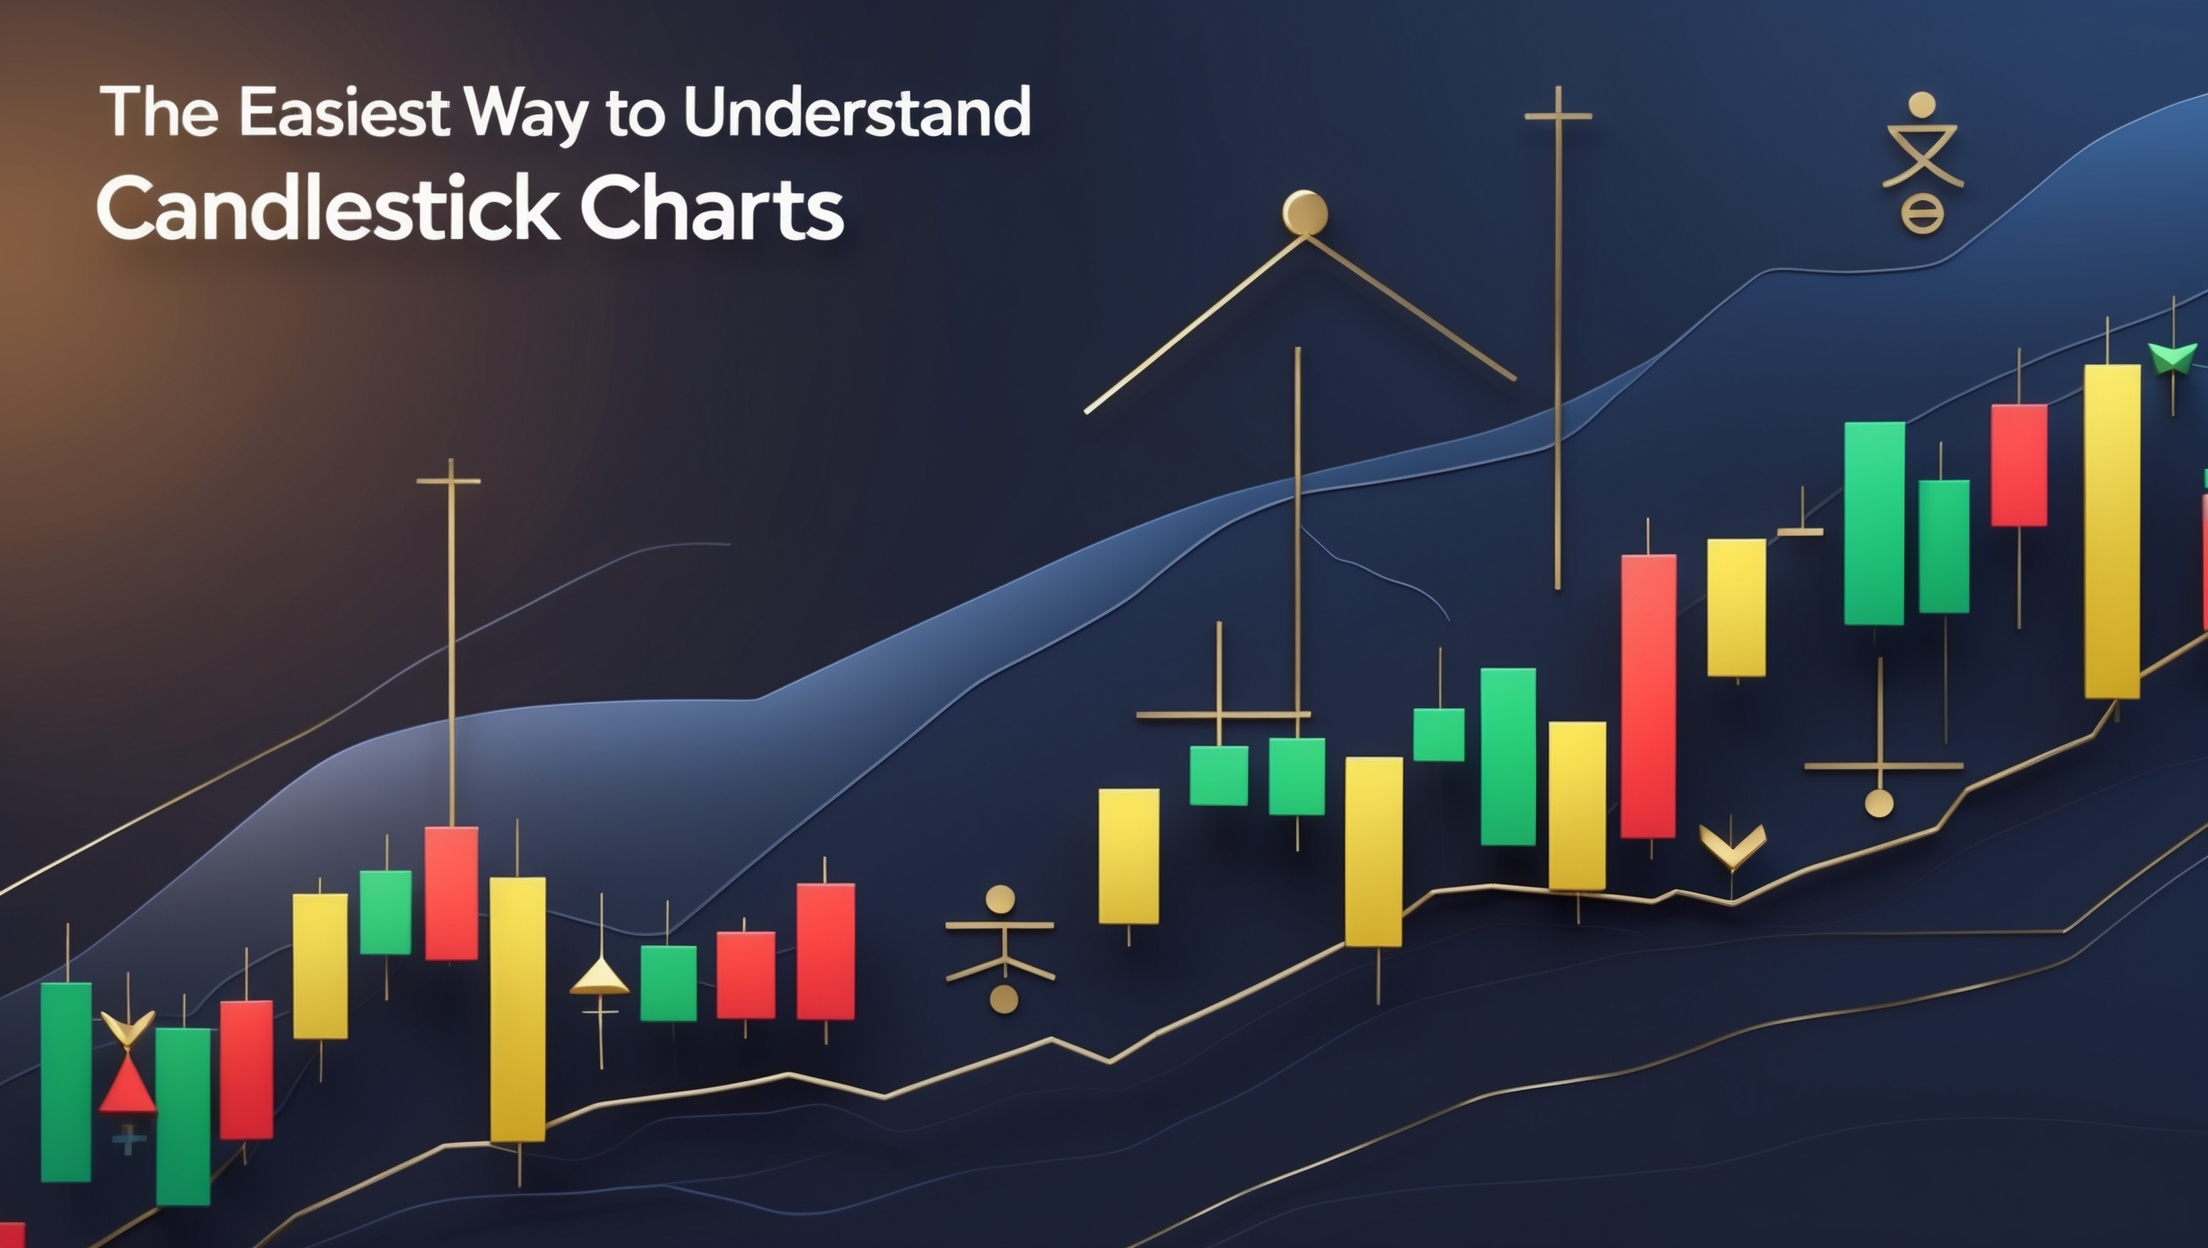
- Green/White Candlestick → Price closed higher than it opened (bullish)
- Red/Black Candlestick → Price closed lower than it opened (bearish)
- Wicks/Shadows → Show the highest and lowest prices during the time period
I learned to focus on patterns rather than individual candlesticks. Certain patterns, like bullish engulfing or hammer, can indicate potential market moves.
Using Candlestick Charts With Beginner Tools
I combine candlestick analysis with apps like Robinhood and Webull to execute trades confidently. Robinhood allows me to start small and test strategies without pressure: Robinhood Affiliate Link.
Webull provides advanced charts and indicators, giving me real-time insights into the market. Even as a beginner, this setup helps me avoid guesswork: Webull Affiliate Link.
Simple Candlestick Patterns for Beginners
I focus on a few easy patterns that provide the most insight:
- Hammer and Hanging Man → Indicates potential reversals
- Bullish/Bearish Engulfing → Shows strong buying or selling pressure
- Doji → Indicates indecision in the market
By starting with these patterns, beginners can spot opportunities without feeling overwhelmed.
Practice Makes Perfect
I practice by analyzing charts on TradingView daily. I look for patterns, track outcomes, and even use paper trading to test strategies. Beginners can do the same—hands-on practice accelerates learning more than any tutorial.
Combining Candlestick Charts With Strategy
Candlestick charts are most powerful when combined with:
- Trend lines and support/resistance
- Volume analysis
- Moving averages and RSI indicators
This combination allows me to make informed trades and reduce risk, even as a beginner.
Mindset Tips for Beginners
- Focus on learning, not perfection
- Start small to reduce stress and overthinking
- Track all trades to learn from patterns and mistakes
- Combine candlestick charts with simple strategies to gain confidence
Learning From Every Trade
Even my first trades with candlestick analysis taught me valuable lessons. Each trade showed me how patterns played out in real time, helping me refine my strategy. Beginners should embrace this learning mindset—every trade is an opportunity to grow.
Final Thoughts
Candlestick charts may look intimidating at first, but with a beginner-friendly approach, they become one of your most powerful tools for stock trading. Using TradingView for analysis and executing trades on Robinhood or Webull, you can start small, learn consistently, and grow your confidence over time.
Remember, the goal is to understand trends, spot opportunities, and make informed decisions, not to become a charting expert overnight.
Affiliate Links Recap:
- TradingView → https://www.tradingview.com/?aff_id=155687
- Robinhood → https://join.robinhood.com/audreym76
- Webull → https://a.webull.com/3DbkWRSEV8Y5EruPXV
- My eBook → https://stockflowreport.gumroad.com/l/paybillswithstocks
When I first started, I stared at candlestick charts and felt completely lost. But I quickly realized that breaking them down into small, simple parts makes them easy to understand—even for beginners.
I focus on green and red candles first. Green shows buyers are in control, while red indicates sellers. This simple distinction helps me quickly gauge market sentiment.
The wicks or shadows on a candlestick reveal important information about price extremes. I learned that long wicks often indicate a potential reversal, which is invaluable for beginners trying to spot opportunities.
One of the first patterns I learned was the hammer. It looks simple, but it signals that a stock might reverse after a downtrend. Recognizing this early has saved me from panic-selling on multiple occasions.
I also rely on doji candles, which indicate indecision in the market. When I see a doji forming, I usually wait for confirmation before taking any action. Patience is key, especially for beginners.
TradingView has been my go-to platform for analyzing candlestick charts. It allows me to zoom in, compare patterns, and set alerts, making learning much easier than staring at static charts elsewhere.
I use candlestick charts in combination with trend lines. Drawing a trend line over highs or lows helps me see the bigger picture, rather than reacting to every single candle.
I always track volume alongside candlestick patterns. High volume during a bullish engulfing pattern, for example, confirms that buyers are strong and the trend is more likely to continue.
For beginners, I recommend practicing with paper trading on TradingView. I did this for weeks before investing real money. It’s a low-risk way to learn patterns and test strategies.
Even small trades are meaningful. My first $50 trade taught me how candlestick patterns evolve in real time and helped me build confidence without risking too much money.
I also combine candlestick charts with moving averages. Seeing how candles interact with the 50-day or 200-day moving average gives me additional confirmation for my trades.
Learning from other traders is extremely helpful. TradingView’s public ideas section lets me see how others interpret candlestick charts, giving me insight and inspiration for my own trades.
I like to journal each trade, noting the candlestick pattern, entry price, exit price, and outcome. This habit has made a huge difference in learning from mistakes and successes alike.
Patience is critical. Not every candlestick pattern leads to immediate profits. I’ve learned to wait for confirmation before buying or selling, which helps avoid impulsive decisions.
Finally, understanding candlestick charts isn’t just about short-term trades—it builds a foundation for smarter investing. Once you grasp the basics, you can analyze trends, identify opportunities, and grow your portfolio with confidence.

Stay ahead in the stock market! Subscribe to our newsletter and receive exclusive stock flow reports, trading insights, and actionable tips directly in your inbox. Join thousands of traders who get our updates first.