
How to Use TradingView for Easy Stock Chart Analysis
How to Use TradingView for Easy Stock Chart Analysis
Learn how to use TradingView for easy stock chart analysis 📈 I’ll share my personal tips, how I track stocks, and how beginners can use this tool to make smarter trading decisions.
Table of Contents
How to Use TradingView for Easy Stock Chart Analysis
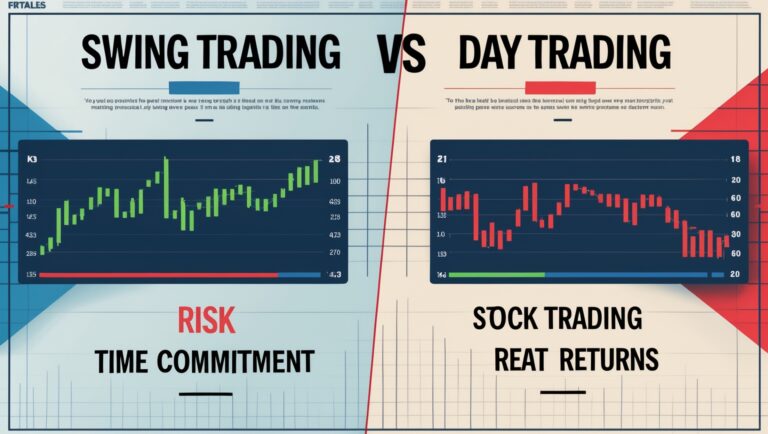
When I first started trading, I was overwhelmed by charts. Candlesticks, indicators, trend lines—it all seemed like a foreign language. But then I discovered TradingView, and it completely changed how I approach the market.
TradingView is a powerful, beginner-friendly tool that allows you to track stocks, spot trends, and make informed trading decisions. Even if you’re new to trading, you can quickly learn to analyze charts and feel confident making trades.
Why TradingView Is My Go-To Tool
I personally rely on TradingView every day. It’s not just for professional traders—beginners can benefit too. I use it to:
- Track real-time stock price movements
- Set alerts for price changes
- Draw trend lines and support/resistance levels
- Analyze technical indicators like moving averages and RSI
Using TradingView gives me confidence in my trades because I can see exactly what’s happening in the market before I make a move. You can start using it here: TradingView Affiliate Link.
Getting Started With TradingView
Starting with TradingView is easier than it seems. Here’s how I guide beginners:
- Sign up: Create an account (there’s a free version with plenty of features).
- Explore charts: Search for any stock and open its chart.
- Add indicators: Moving averages, MACD, RSI, and Bollinger Bands are great for beginners.
- Set alerts: Get notified when a stock reaches a certain price, so you never miss an opportunity.
I remember my first week on TradingView—I felt nervous but excited. After practicing for a few days, I was already spotting trends and patterns I never noticed before.
Simple Strategies for Beginners on TradingView
Even as a beginner, I use TradingView to follow simple strategies:
- Support and Resistance Levels: Identify where stocks usually bounce or drop.
- Trend Lines: See the overall direction of a stock over time.
- Moving Averages: Understand average price movement and identify trends.
- Candlestick Patterns: Learn simple patterns to spot buying or selling opportunities.
These strategies are beginner-friendly and don’t require advanced knowledge to get started.
How I Combine TradingView With My Trades
I use TradingView alongside Robinhood and Webull. I analyze charts on TradingView, plan my trades, and execute them on Robinhood or Webull. This combination allows me to make informed decisions, even as a beginner, and gradually build a portfolio.
Robinhood lets me start small with fractional shares: Robinhood Affiliate Link
Webull gives me more advanced trading tools: Webull Affiliate Link
Tips for Beginners Using TradingView
- Start with a free account: You can explore most features without paying.
- Focus on a few indicators: Don’t get overwhelmed—master one or two before adding more.
- Use alerts: Never miss an opportunity even if you’re away from your screen.
- Draw notes on charts: I write reminders and insights directly on TradingView—it helps me track patterns.
- Practice with paper trading: Use virtual funds to test strategies before risking real money.
Learning While Using TradingView
TradingView is also educational. As I track stocks, I learn how markets react to news, earnings reports, and trends. This hands-on experience is far more effective than reading theory alone.
My eBook also complements TradingView. It explains how I pay my bills trading stocks and includes practical examples of how I use chart analysis to make informed trades. Grab it here: Pay Bills With Stocks eBook.
Final Thoughts
TradingView makes stock chart analysis easy and accessible for beginners. By combining it with apps like Robinhood and Webull, I can plan, execute, and track trades confidently. Beginners should focus on learning the basics, experimenting with charts, and gradually building their skills.
Remember, the goal isn’t to become an expert overnight—it’s to learn, track trends, and make informed decisions. TradingView is the perfect tool to start that journey.
Affiliate Links Recap:
- TradingView → https://www.tradingview.com/?aff_id=155687
- Robinhood → https://join.robinhood.com/audreym76
- Webull → https://a.webull.com/3DbkWRSEV8Y5EruPXV
- My eBook → https://stockflowreport.gumroad.com/l/paybillswithstocks
When I first opened TradingView, I felt overwhelmed by all the tools and indicators. But I quickly learned that you don’t need to use everything at once. Focus on a few key indicators like moving averages and RSI, and you’ll start seeing patterns faster.
One of the first things I did was set up alerts for my favorite stocks. This way, even if I wasn’t at my computer, I knew exactly when a stock hit a certain price. Alerts are a beginner-friendly way to stay on top of the market without stress.
I love how TradingView allows me to draw trend lines and support/resistance levels directly on the chart. This visual approach helps me make better decisions and quickly spot entry and exit points.
Candlestick charts were intimidating at first, but TradingView makes them easy to understand. I learned to identify simple patterns like bullish and bearish trends, which became the foundation of my trading strategy.
I also use TradingView to track multiple timeframes. For example, I check daily charts for long-term trends and 15-minute charts for short-term opportunities. This multi-timeframe approach has helped me make smarter trades.
Another beginner tip: practice paper trading first. TradingView has a built-in simulator that lets you test strategies without risking real money. I used this feature extensively before I started trading with Robinhood and Webull.
I combine TradingView with Robinhood for execution. I analyze trends and set targets on TradingView, then place trades on Robinhood. It’s a seamless system that helps me trade efficiently even as a beginner.
Webull is another great complement. I use it for real-time data and additional analysis. By combining these tools, I can make informed trades without guessing. This is how beginners can start building confidence quickly.
I also track my trades in a personal journal, noting why I entered or exited each position. TradingView makes it easy to screenshot charts and add notes, which has been invaluable in learning from my mistakes.
Education is ongoing. I spend time each day exploring TradingView’s features, tutorials, and public ideas. Watching how other traders use charts has given me insight and accelerated my learning.
I also incorporate technical indicators gradually. Start with moving averages, RSI, and MACD. Once you’re comfortable, explore Bollinger Bands or Fibonacci retracements. Adding complexity too soon can overwhelm beginners.
Even small trades are valuable learning experiences. I remember analyzing a stock on TradingView, placing a $50 trade, and learning more in that single day than from weeks of reading about the market.
I often check volume and price action together. TradingView makes it easy to visualize both, helping me understand market momentum and avoid potential traps.
Using TradingView also improves discipline. By planning trades, setting alerts, and tracking every move, I avoid impulsive decisions and stick to a consistent strategy.
Finally, beginners should remember that practice and patience are everything. TradingView is a tool, but real growth comes from learning, experimenting, and reflecting on each trade. Even small, consistent efforts compound into knowledge and wealth over time.

Stay ahead in the stock market! Subscribe to our newsletter and receive exclusive stock flow reports, trading insights, and actionable tips directly in your inbox. Join thousands of traders who get our updates first.