
The Ultimate Guide to Reading Stock Charts for Beginners
The Ultimate Guide to Reading Stock Charts for Beginners
Reading stock charts can feel intimidating when you’re starting out. I remember staring at lines and candles, unsure what they meant. In this ultimate beginner’s guide, I’ll show you how to read stock charts effectively, spot trends, and make smarter trading decisions, plus the tools I use to trade confidently and pay my bills monthly with stocks.

Table of Contents
Why Learning to Read Stock Charts Matters
Stock charts are the foundation of trading. They show price movements, trends, and potential buy or sell opportunities.
When I first began, I ignored charts and relied on intuition, which led to losses. Learning to read charts properly transformed my trading strategy and results.
The Basics of Stock Charts
There are a few types of charts every beginner should know:
Line Charts
Line charts are simple and show the closing prices over a period. They’re great for spotting long-term trends without distractions.
Bar Charts
Bar charts display open, high, low, and close prices. They help beginners understand price movement and volatility better than line charts.
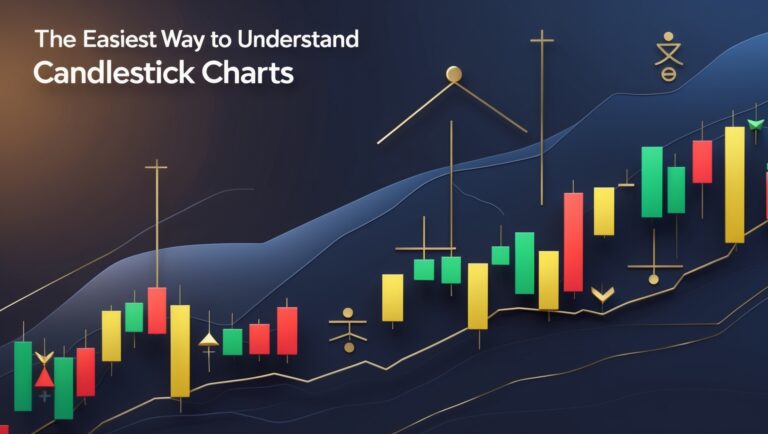
Candlestick Charts
Candlestick charts are the most popular for traders. Each candle shows the open, close, high, and low for a period and helps identify market sentiment.
Understanding Trends
Trends are essential for spotting opportunities. An uptrend shows higher highs and higher lows, while a downtrend shows lower highs and lower lows.
I rely on trendlines and moving averages to confirm trends before entering trades, which helps me trade more confidently.
Support and Resistance Levels
Support and resistance levels indicate where prices may bounce or reverse.
- Support: The price level where buying interest is strong
- Resistance: The price level where selling interest is strong
Marking these levels on charts helps me identify high-probability entry and exit points.
Using Indicators for Confirmation
Indicators like RSI, MACD, and moving averages confirm what the charts are showing. They reduce guesswork and help me spot buy and sell signals more accurately.
Using TradingView allows me to combine charts and indicators seamlessly, making analysis faster and easier.
How I Apply Chart Reading in My Trading
I pair chart patterns with indicators and alerts to create a reliable trading system. My ebook, How I Pay My Bills Monthly With Stocks, shows exactly how I use charts to analyze opportunities and generate consistent income.
Even as a beginner, following this structured approach helped me trade confidently and avoid common mistakes.
Getting Started Today
Start with one type of chart, practice reading trends, and gradually add indicators. Use watchlists and alerts to stay on top of key opportunities.
- Sign up for TradingView to practice chart reading and set alerts: https://www.tradingview.com/?aff_id=155687
- Learn my full system for turning chart analysis into monthly income: https://stockflowreport.gumroad.com/l/paybillswithstocks
With the right tools and approach, reading stock charts becomes simple, actionable, and profitable—even for beginners.
When I first started, I felt overwhelmed by all the lines and candles on a chart. Focusing on one chart type at a time helped me gradually build my understanding.
Line charts are perfect for beginners. They make it easy to see overall trends without being distracted by price fluctuations.
Bar charts are slightly more detailed. They allow you to see the open, high, low, and close for each period, which helps in spotting volatility and potential reversals.
Candlestick charts quickly became my favorite. The shapes and colors of candles indicate market sentiment, making it easier to anticipate price movements.
Understanding trends is crucial. Spotting an uptrend or downtrend helps me decide whether to buy, sell, or wait before entering a trade.
I also learned to draw trendlines to visualize the direction of the market. Connecting highs or lows helps me identify support and resistance levels faster.
Support and resistance are game-changers for beginners. They show me where prices are likely to bounce or reverse, which improves my entry and exit timing.
Indicators like RSI and MACD confirm what I see on the charts. They give me extra confidence before placing trades and reduce emotional decision-making.
Volume is another key factor. Watching how volume changes with price action helps me spot strong moves and avoid weak signals.
Alerts and notifications save me time. Using TradingView, I can set alerts for key price levels, indicators, or chart patterns, so I never miss an opportunity.
I also practice keeping a trading journal. Logging chart patterns, entries, and outcomes helps me learn from mistakes and refine my strategy over time.
Finally, pairing chart reading with a structured system, like in my ebook How I Pay My Bills Monthly With Stocks, turns learning into actionable results, helping me trade confidently and consistently.
One thing I quickly learned is that patience is key. Not every chart pattern or indicator signal leads to an immediate trade. Waiting for confirmation reduces mistakes and improves results.
I also focus on timeframes. Some signals are clearer on daily charts, while others appear on hourly or weekly charts. Using the right timeframe improves my trading accuracy.
Combining chart reading with watchlists and alerts allows me to focus only on the stocks that meet my criteria, saving time and reducing stress.
Lastly, simplicity matters. By mastering a few key chart types, understanding trends, and using a handful of reliable indicators, even beginners can read stock charts confidently and trade successfully.
One thing I focus on is recognizing common chart patterns like head and shoulders, double tops, and triangles. Learning these patterns helped me spot potential reversals and breakouts faster.
I also combine chart reading with simple indicators like moving averages and RSI. This combination confirms signals and gives me more confidence before entering trades.
Finally, practicing consistently is key. Spending 10–15 minutes daily reviewing charts, drawing trendlines, and observing patterns has made me much more comfortable and confident as a trader.

Stay ahead in the stock market! Subscribe to our newsletter and receive exclusive stock flow reports, trading insights, and actionable tips directly in your inbox. Join thousands of traders who get our updates first.