Understanding Support and Resistance Levels in Stocks
Understanding Support and Resistance Levels in Stocks
Support and resistance levels are essential concepts in stock trading. They represent price points where a stock tends to stop and reverse its direction. By learning how to identify and use these levels, traders like myself can make smarter buying and selling decisions. In this guide, I’ll break down what support and resistance levels are, why they matter, and how I personally use them in my trading strategy.
Table of Contents
Introduction
When I first started trading, I kept hearing the terms support and resistance being thrown around. At first, they sounded complicated, but once I really studied them, I realized they are some of the most powerful tools in technical analysis.
Understanding these levels has helped me avoid bad trades and time my entries much better. If you’ve ever wondered why a stock suddenly bounces back up or why it struggles to break through a certain price, the answer often lies in support and resistance.
In this post, I’ll explain:
- What support and resistance levels really mean
- How I personally identify them on stock charts
- Different types of support and resistance
- Mistakes to avoid when using them
- How to integrate them into a complete trading strategy
And at the end, I’ll also share a resource that has helped me structure my trading approach so I can actually pay my bills with stocks.
Before we dive in, check out my ebook here: Pay Bills with Stocks.
What Are Support Levels?
A support level is a price area where a stock tends to stop falling and starts bouncing back up. Think of it as the “floor” of a stock’s price.
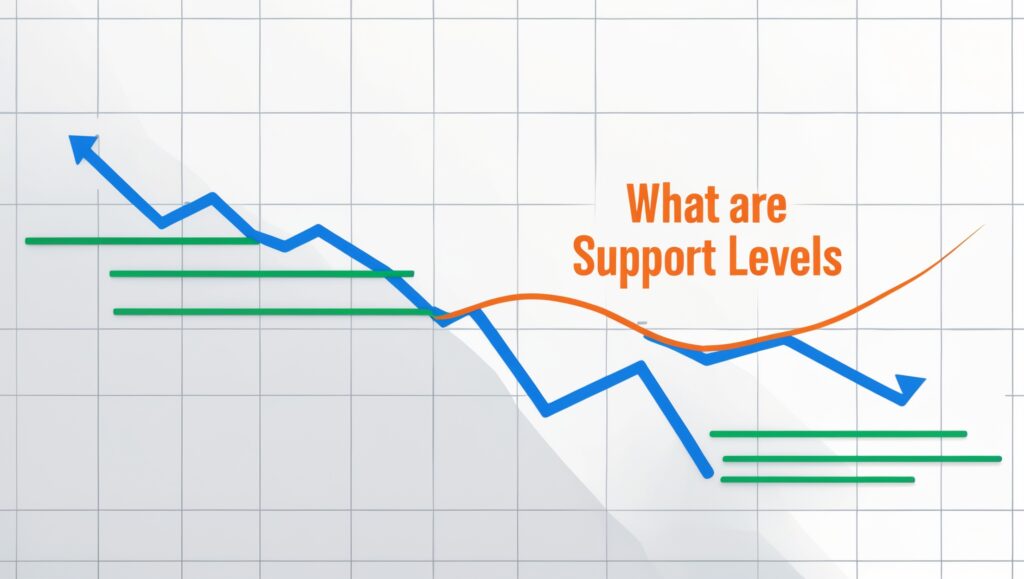
From my experience, support levels form when buyers see value at a certain price and step in to buy, preventing the price from dropping further.
For example:
- If a stock keeps bouncing back around $50, that $50 level is acting as support.
- Buyers believe that price is “cheap,” so demand picks up there.
I personally love identifying strong support levels because they give me safer entry points for trades.
What Are Resistance Levels?
A resistance level is the opposite. It’s a price area where a stock keeps struggling to move higher. It’s like the “ceiling” of a stock’s price.
Resistance happens when sellers step in and unload shares at a certain price, causing the stock to stall or reverse downward.
For example:
- If a stock keeps reaching $75 but fails to go higher, that $75 level is acting as resistance.
Whenever I’m planning a trade, I always check where the nearest resistance is because that’s often where profits can get capped.
Why Support and Resistance Levels Matter
Here’s why I consider these levels so powerful in my trading:
- Timing Entries and Exits – Buying at support and selling near resistance increases my probability of success.
- Risk Management – Support levels often guide me where to place stop-loss orders.
- Market Psychology – These levels reflect how traders as a whole feel about a stock.
- Trend Confirmation – If a stock breaks resistance, it can signal a new bullish trend.
Without these levels, I’d basically be trading blind.
Different Types of Support and Resistance
Through my own journey, I’ve learned that not all support and resistance levels are the same. Here are the main types I use:
1. Horizontal Support and Resistance
These are the most common and easiest to spot. They form at previous highs and lows.
- Example: A stock keeps bouncing off $40 → support.
- It keeps hitting $60 but failing → resistance.
2. Trendline Support and Resistance
When a stock moves consistently in a trend, I draw diagonal lines connecting the highs and lows. These act as dynamic support or resistance.
3. Moving Averages
Certain moving averages, like the 50-day or 200-day, often act as support in uptrends and resistance in downtrends.
4. Psychological Levels
Round numbers like $10, $50, or $100 often act as support/resistance because traders naturally react to them.
5. Fibonacci Levels
I use Fibonacci retracements to find hidden support/resistance levels that many traders watch.
How I Identify Support and Resistance Levels
Here’s the exact process I use when analyzing a stock:
- Zoom Out First – I check daily or weekly charts to see the big picture.
- Mark Key Highs and Lows – I draw horizontal lines where price repeatedly reacts.
- Look for Volume Confirmation – Strong levels often have higher trading volume around them.
- Add Trendlines – If the stock is trending, I connect higher lows or lower highs.
- Double Check with Moving Averages – If a level aligns with a 50-day or 200-day MA, I consider it even stronger.
This process keeps me disciplined and prevents me from guessing.
Support Becoming Resistance (and Vice Versa)
One thing that really blew my mind when I learned it is that support can turn into resistance once it’s broken, and vice versa.
For example:
- If a stock breaks below $50 (support), that $50 can act as resistance when the price tries to climb back up.
- If a stock breaks above $75 (resistance), that level can turn into new support.
I’ve seen this happen countless times, and I always respect these “flipped” levels in my trades.
Common Mistakes Traders Make with Support and Resistance
Over the years, I’ve made (and seen others make) some common mistakes:
- Forcing Levels – Just because I want a level to exist doesn’t mean it’s real. I only use areas where price has reacted multiple times.
- Ignoring Timeframes – Support on a 1-minute chart is way weaker than on a daily chart.
- Not Waiting for Confirmation – Jumping in too early before the level proves itself can lead to bad trades.
- Treating Levels as Exact Prices – They’re zones, not exact numbers. Price can overshoot slightly before reversing.
Learning from these mistakes has saved me a lot of money.
How I Use Support and Resistance in My Trading
I combine support and resistance with other indicators to make smarter trades:
- Entries: I buy near support when volume confirms buyers are stepping in.
- Exits: I take profits near resistance.
- Stop-Losses: I set stops just below strong support to protect myself.
- Breakouts: If resistance breaks with strong volume, I might enter a momentum trade.
Support and resistance are never the only thing I use, but they are always the foundation of my setups.
Real-World Example
Let me give you a quick scenario from my trading:
- Stock XYZ has strong support at $100 and resistance at $120.
- I wait for the stock to come close to $100.
- Volume increases, and it bounces.
- I enter a trade at $102.
- My stop-loss is at $98 (below support).
- I take profits at $118 (near resistance).
That’s a clean, structured trade built purely on support and resistance.
Why I Trust Support and Resistance
At the end of the day, these levels are built on trader psychology. They represent areas where thousands of traders agree that a stock is either cheap (support) or expensive (resistance).
That’s why they work so often — because so many traders are watching the same levels.
Final Thoughts
Learning about support and resistance levels completely changed the way I trade stocks. Instead of guessing, I now have clear zones that guide my entries, exits, and risk management.
If you’re serious about trading, mastering these levels is non-negotiable. But they’re only one part of the bigger picture.
To see how I combine support, resistance, and other strategies to actually make consistent income from trading, grab my ebook here:
Pay Bills with Stocks
It’s my personal guide where I share the exact methods I use to grow my trading account and pay real-life bills with stock profits.

Stay ahead in the stock market! Subscribe to our newsletter and receive exclusive stock flow reports, trading insights, and actionable tips directly in your inbox. Join thousands of traders who get our updates first.